Business–Driven Cybersecurity 🔑
Automation Application
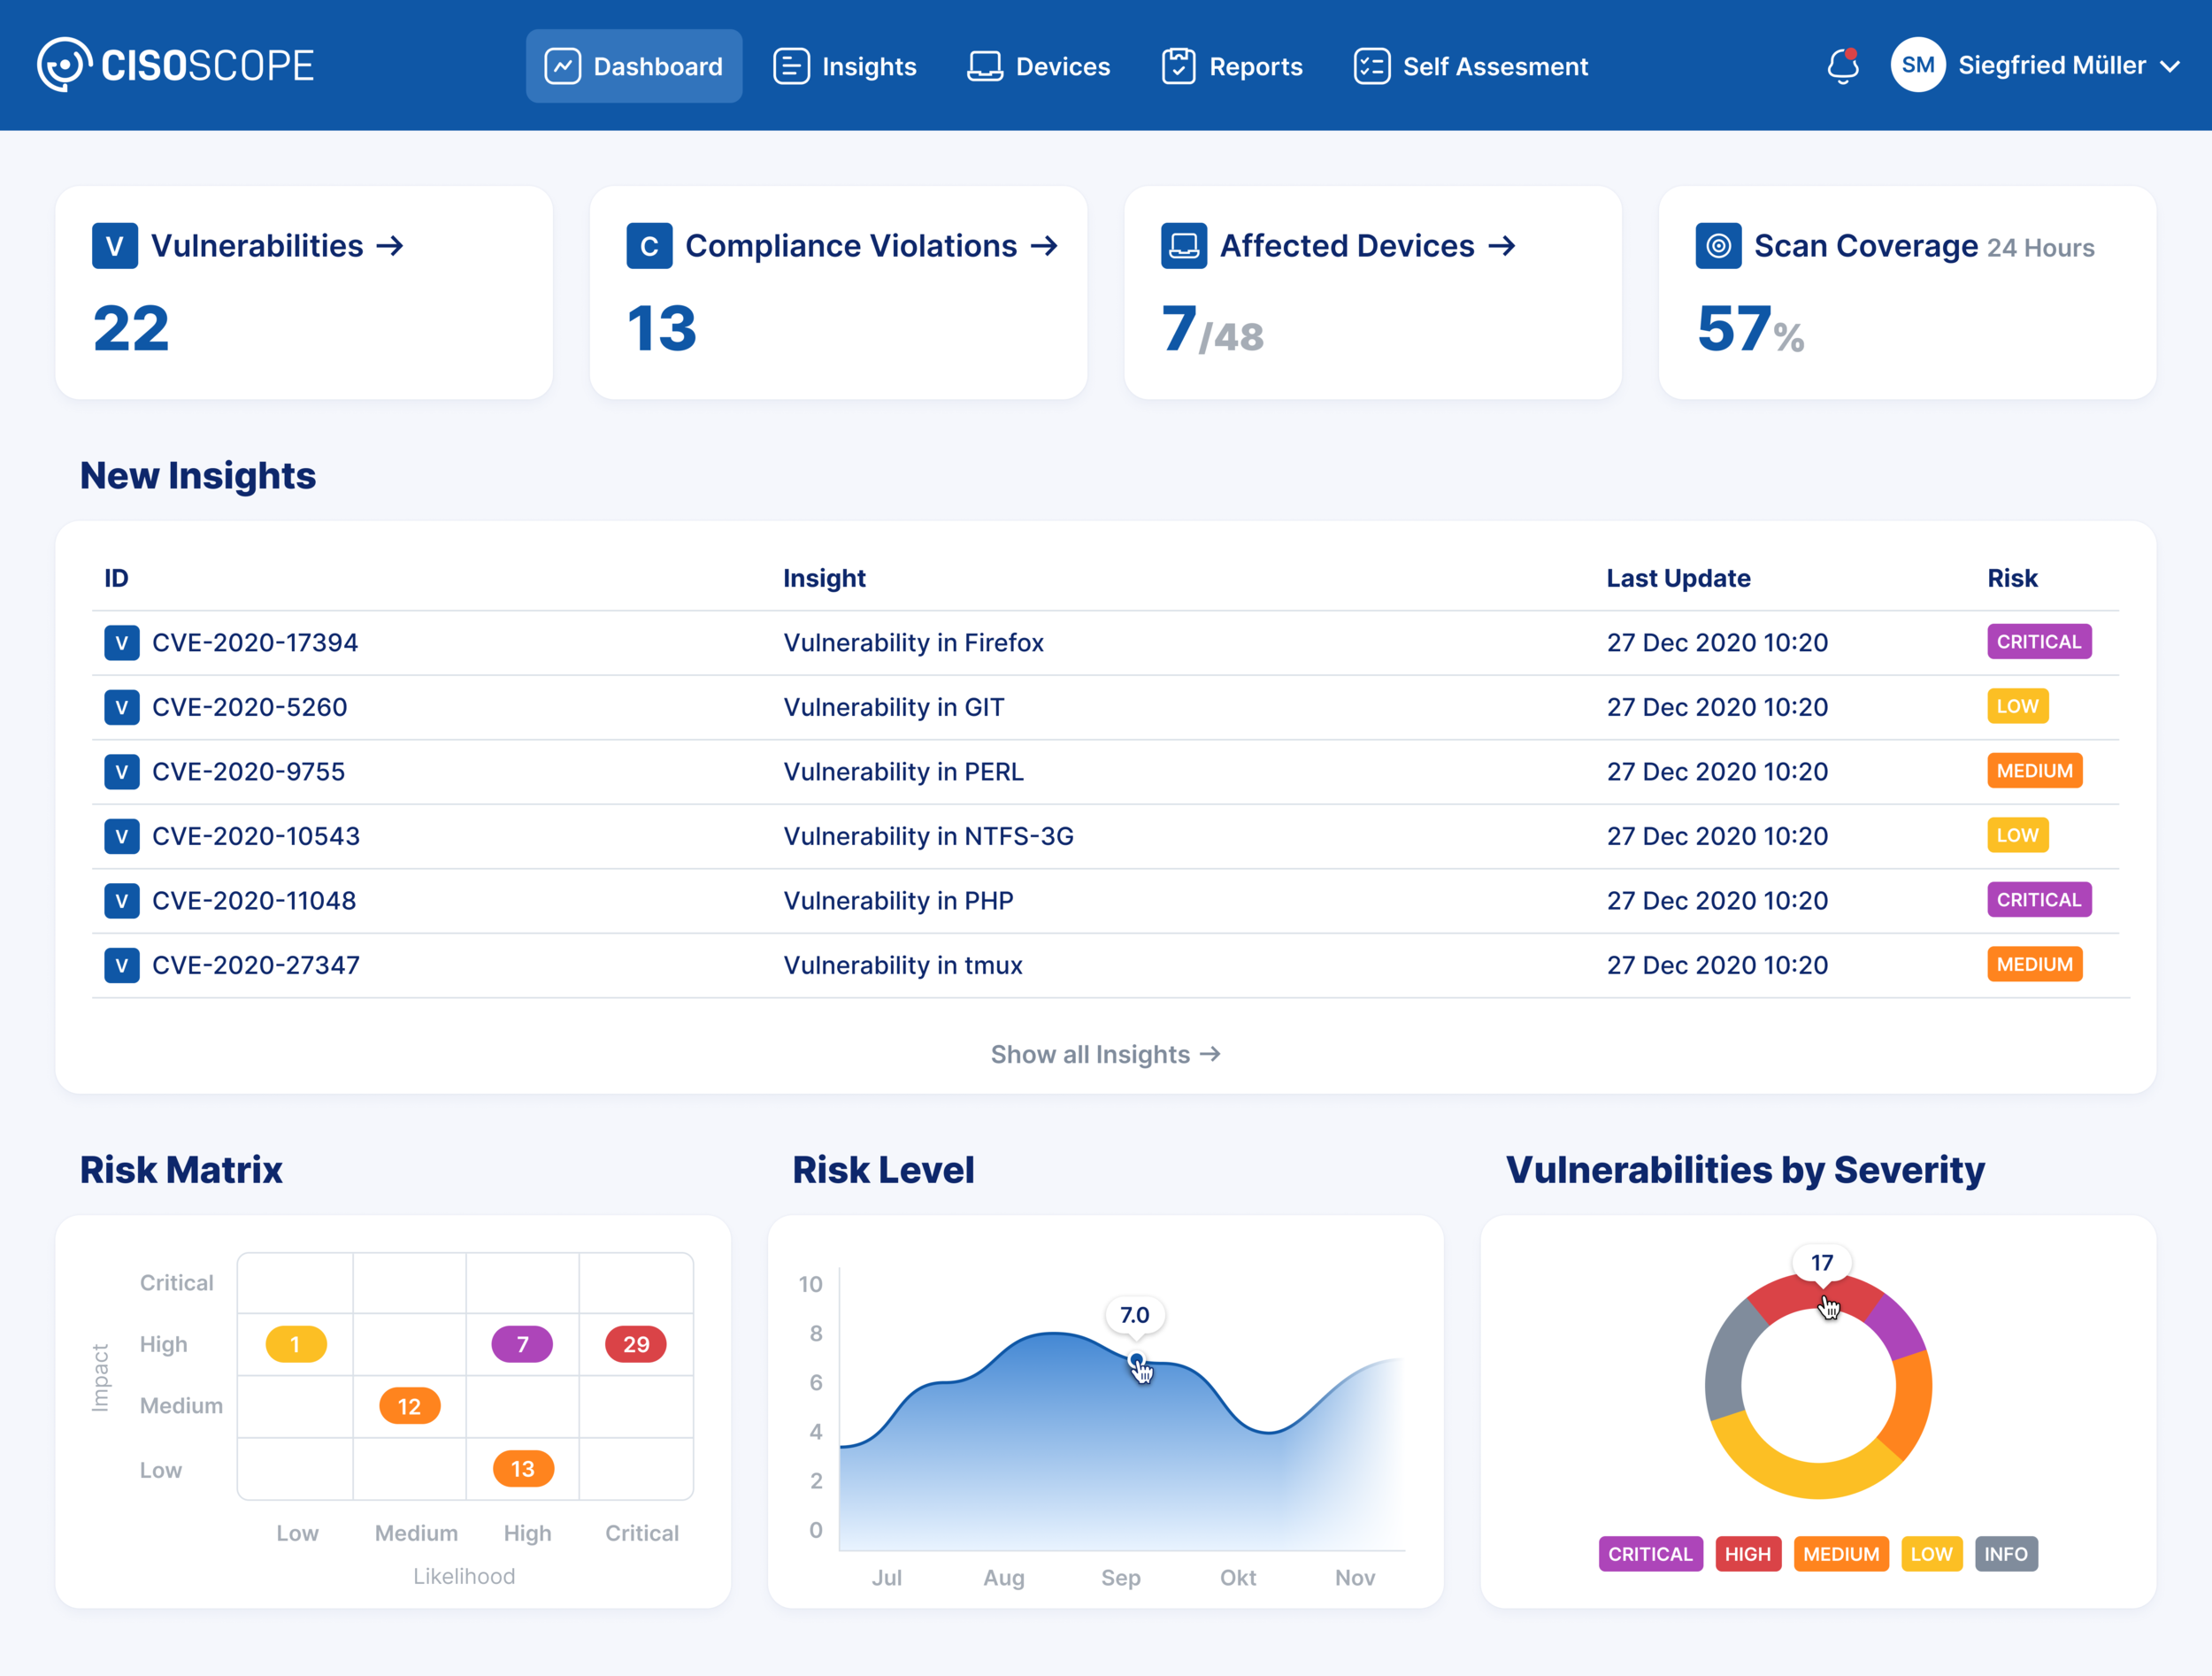
The project goal was to create software for Chief Information Officers which helps them to monitor the threats, vulnerabilities and measure cyber risks. It provides a vendor-independent analysis of appearing information security problems on the devices and software used in a client company.
Together with Julian Krenz we collected information about the tasks and duties of information security specialists designed a web-based application for chief information officers.
Insights: a list of issues found on the devices owned by the company. Insight’s ID, type, risk level, and the last update date are presented in the table above. There is an opportunity to filter the existing list according to the kind of insight, business domain, type of application, date and risk level.
Detailed view of Insight’s ID: a user can review all information about the finding provided by the analytical system, choose a response and add ticket ID from Jira in the table showed on a screen.
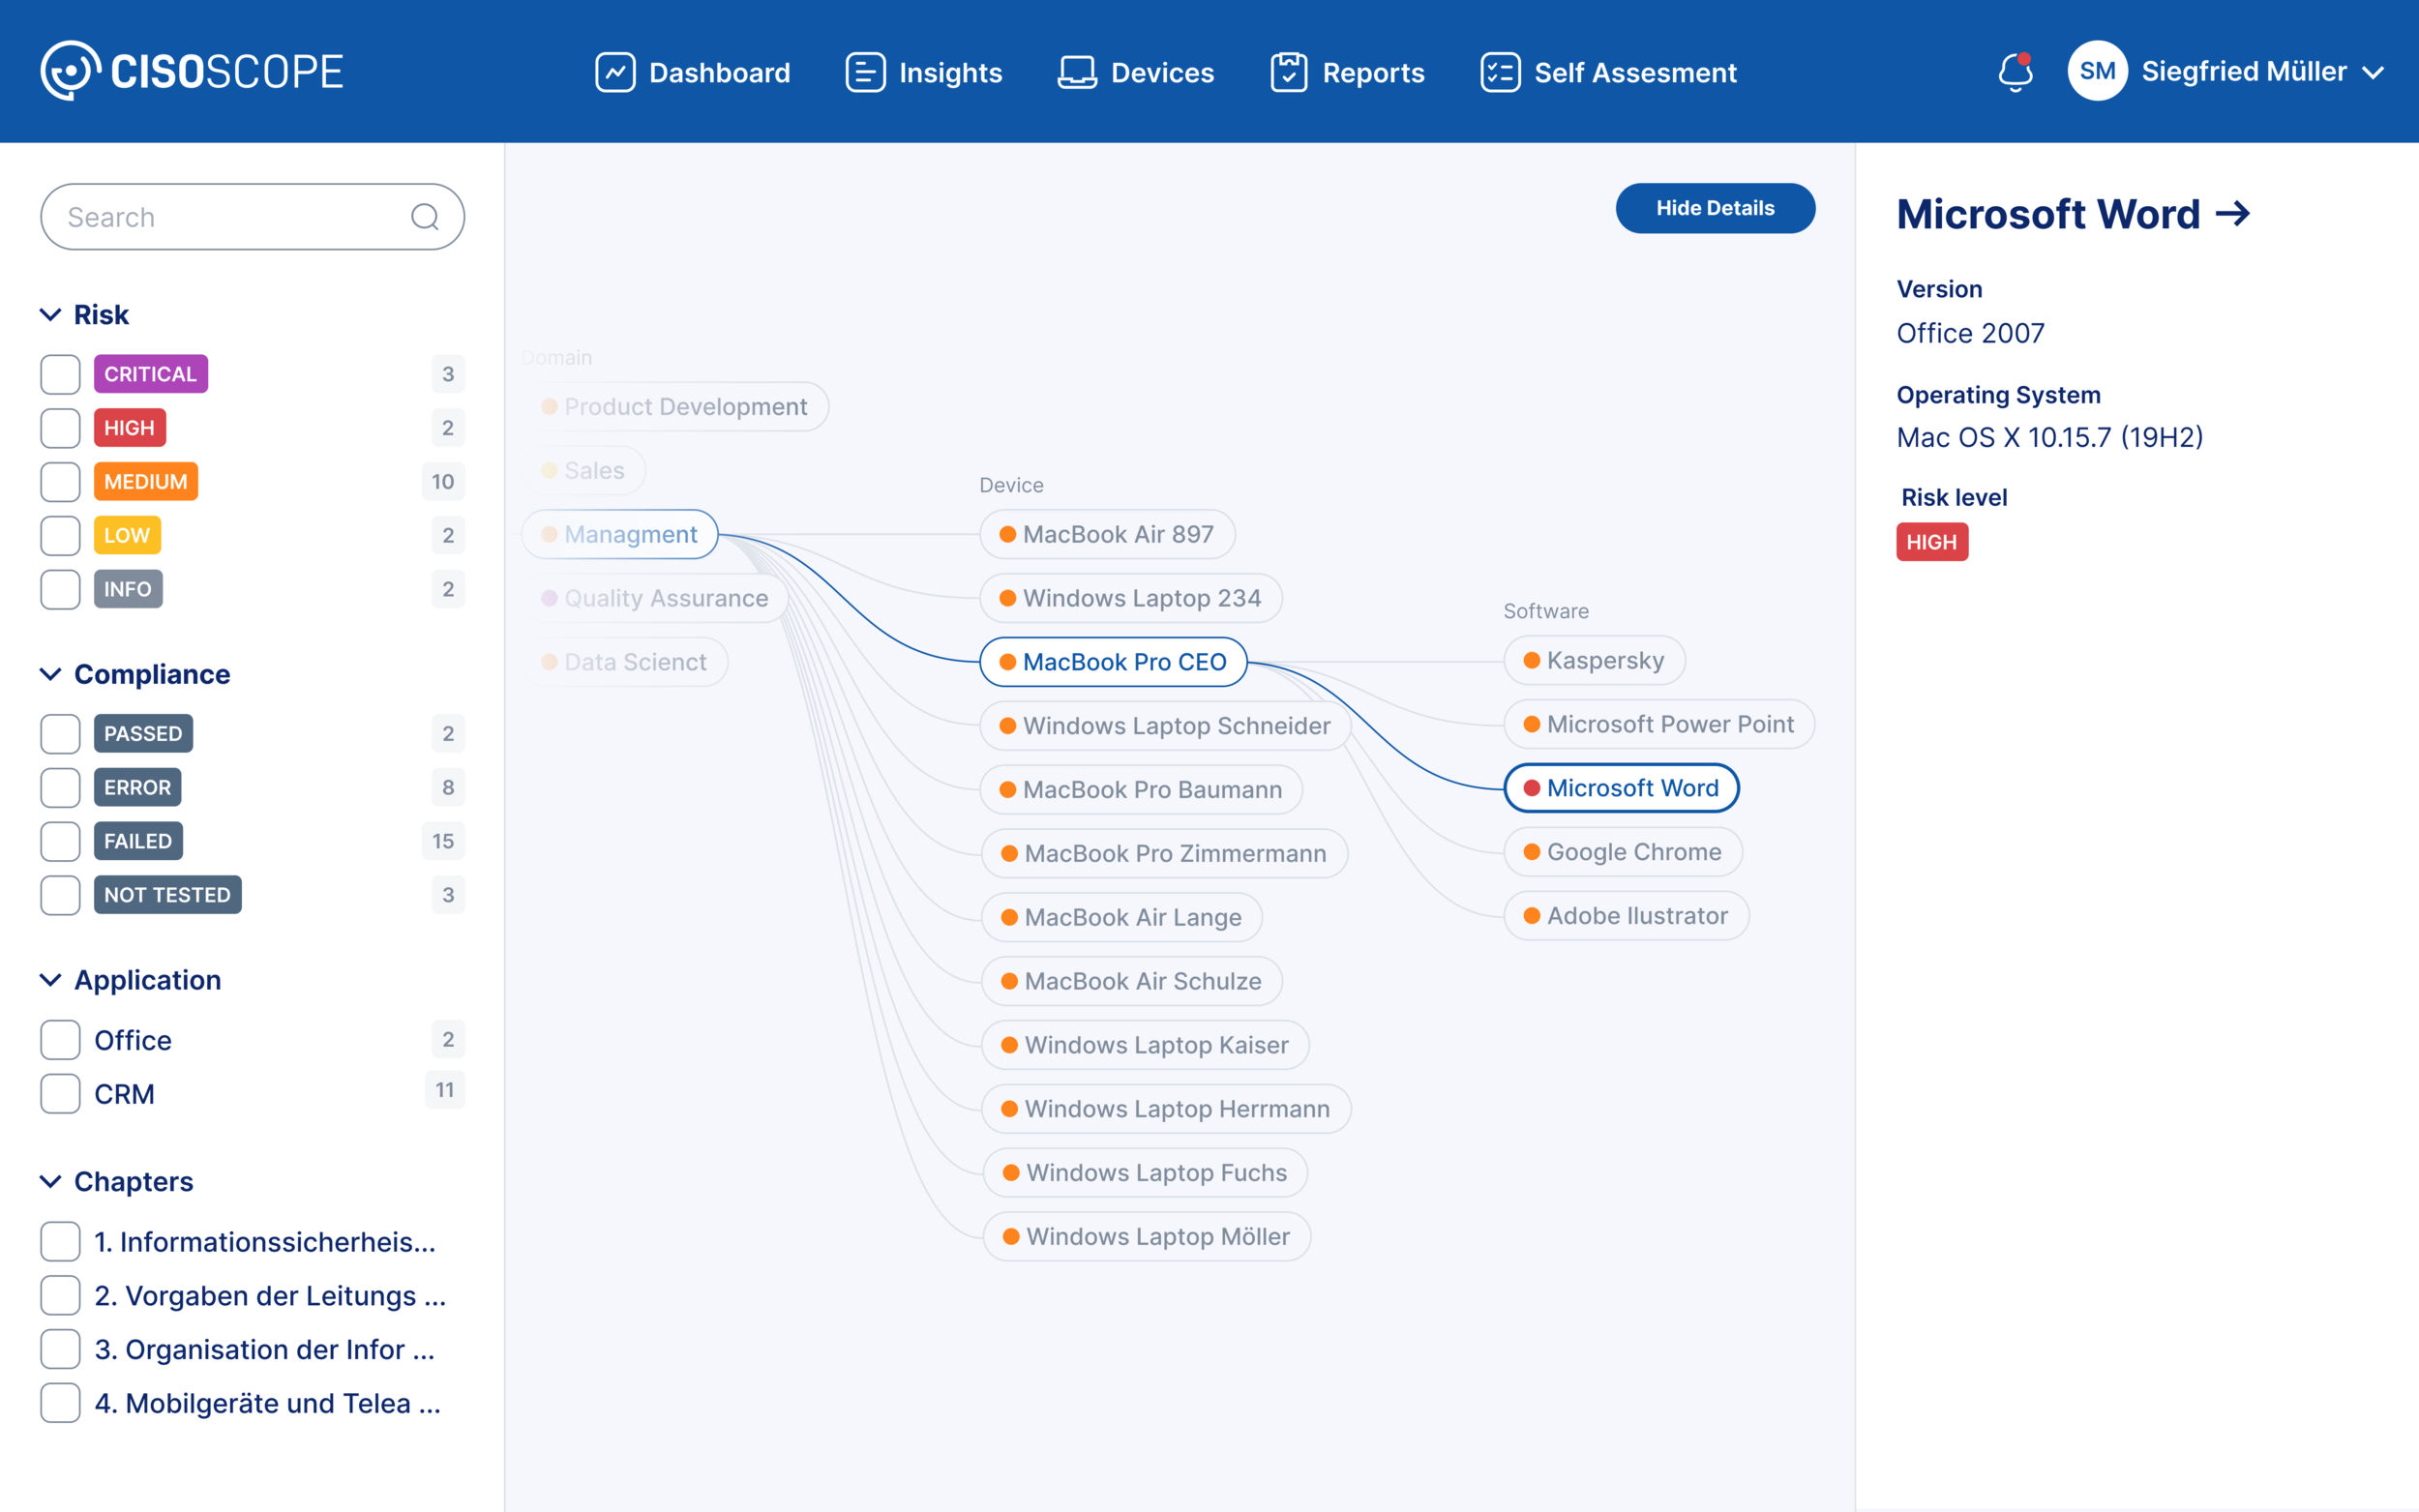
Knowledge graph is a visual representation of all devices owned by the company and software which is installed in these devices. All information about the devices and software is provided in the sidebar “Details”.
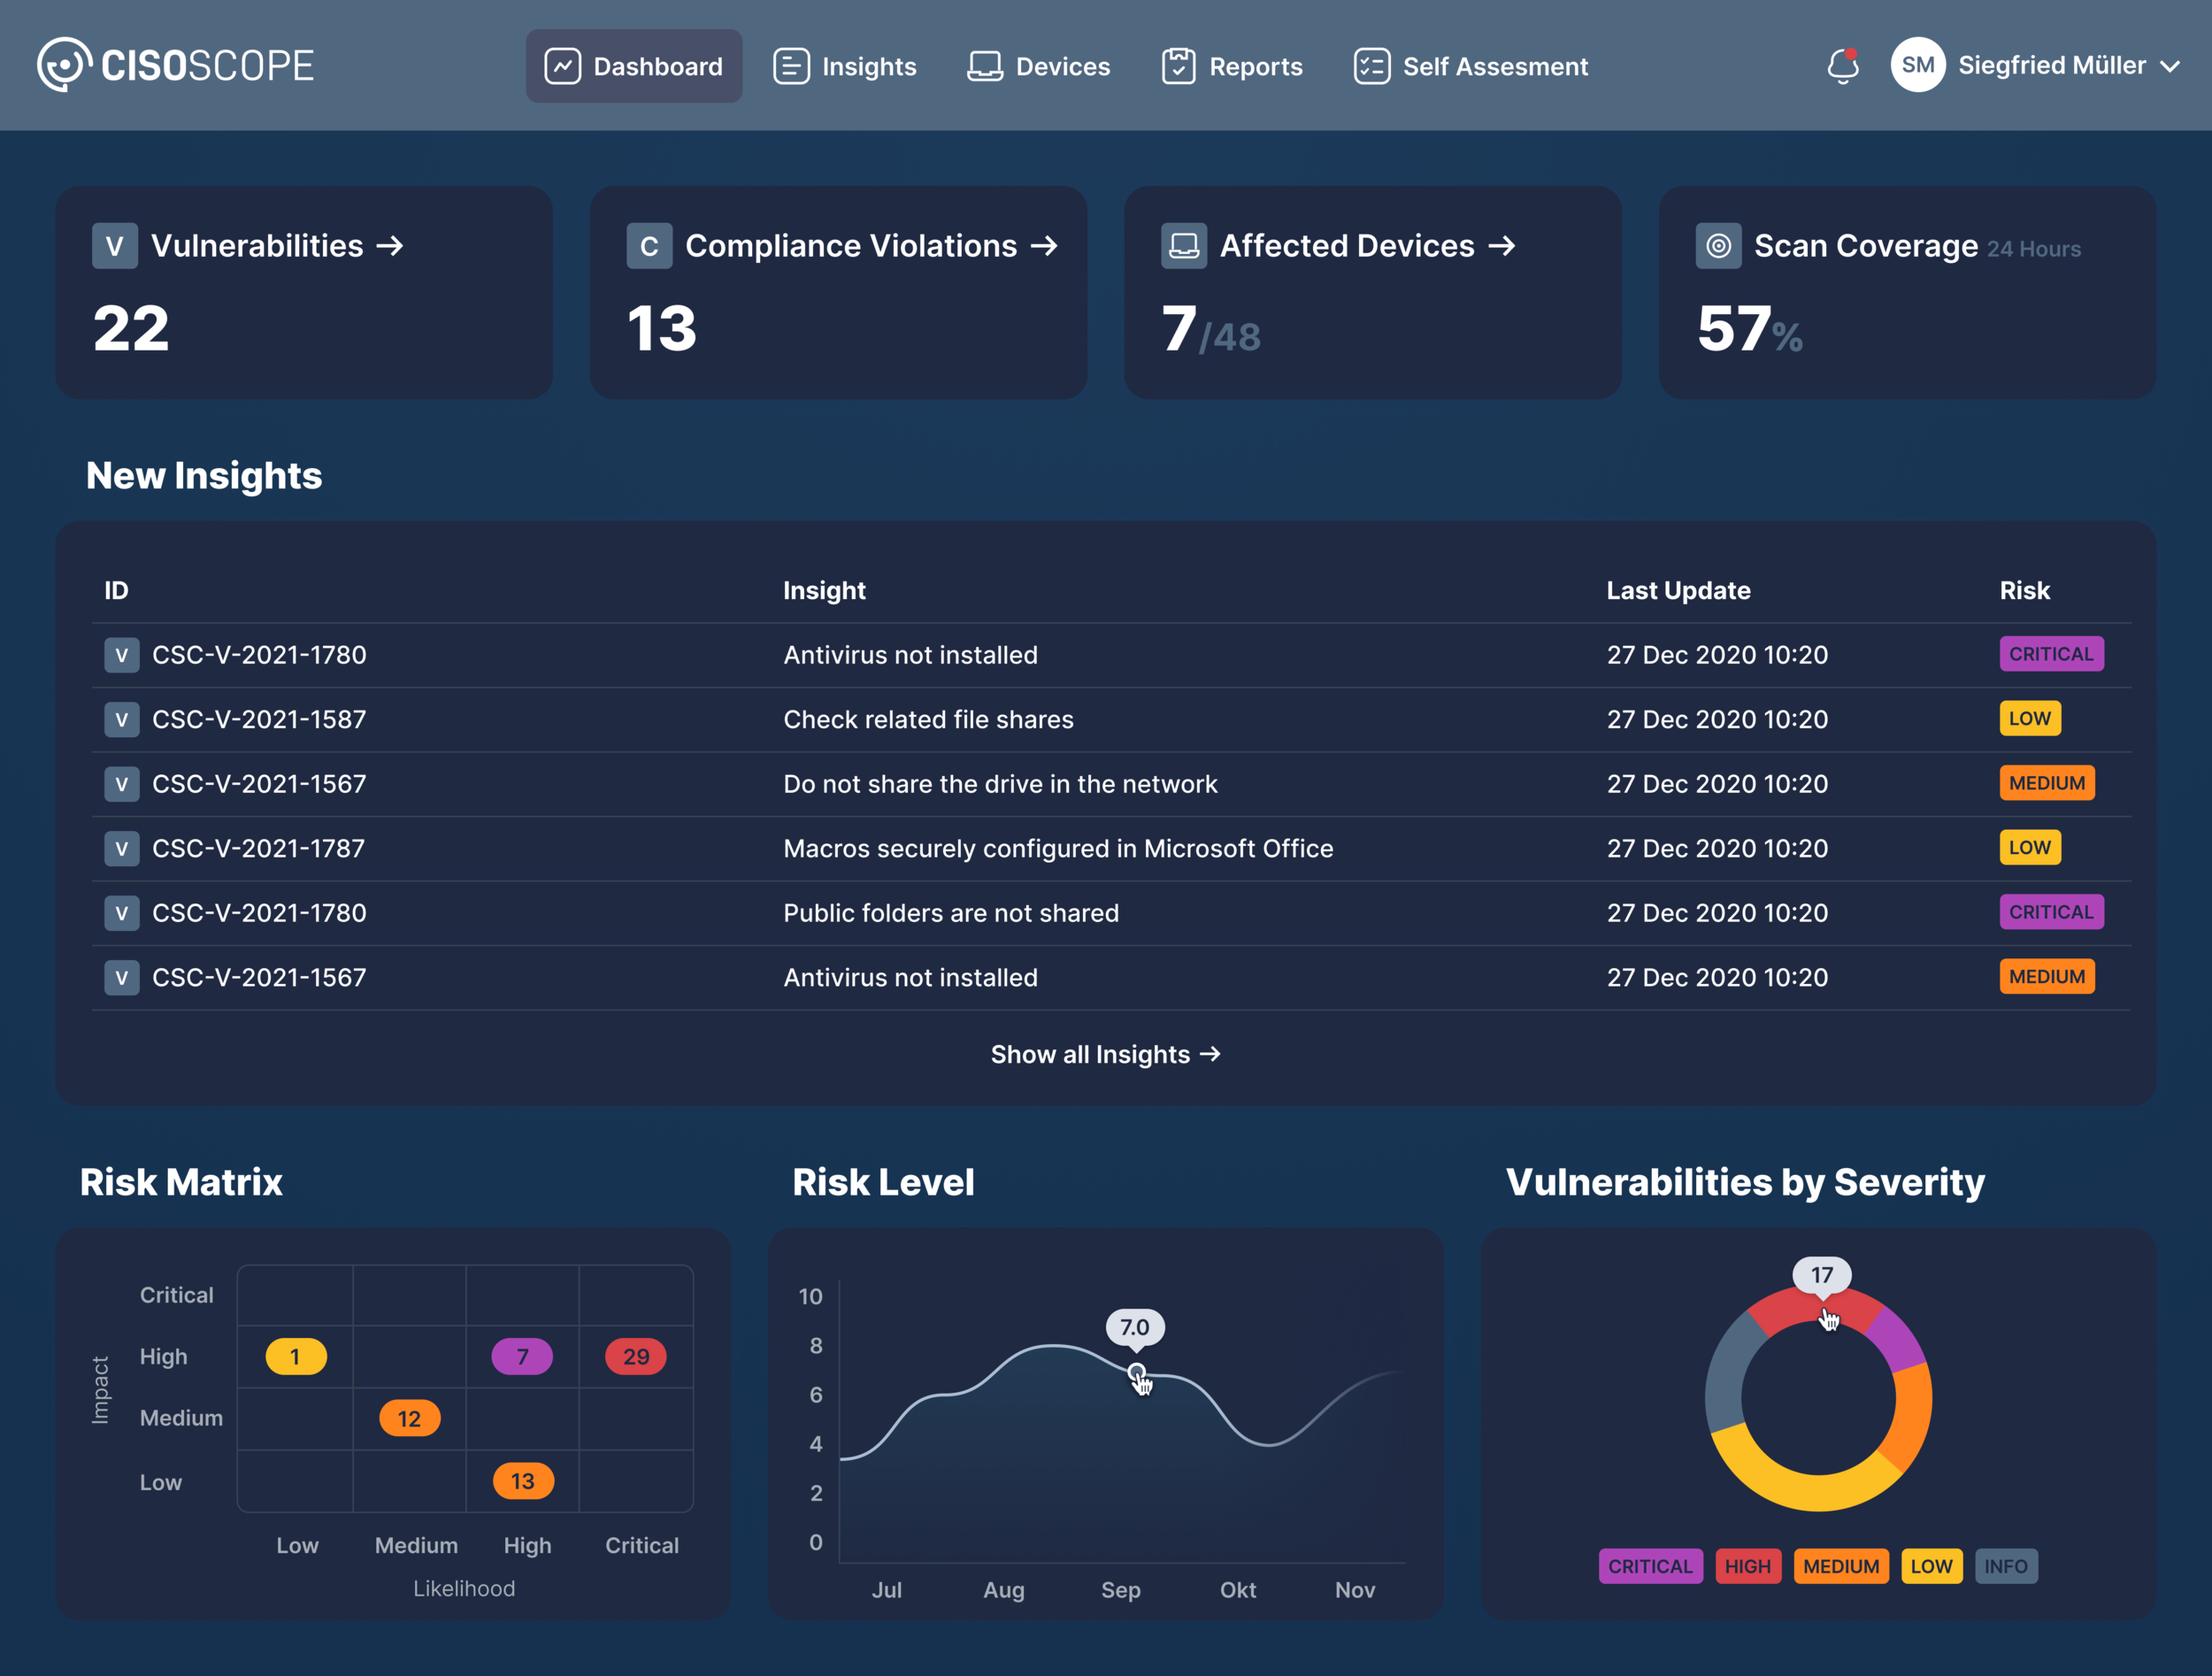
Main dashboard in a dark mode: This is the first screen user see after logging in to the web-application. The dashboard represents a short summary of all insights, risks and assigned tasks (appears in Notifications).
Device detail view in a dark mode: All information about the device and issues with the software are represented on this screen.
Art direction: Julian Krenz


